Thursday, January 29, 2009

Proportional circle map


Proportional circle maps display data in relation to the size of the circles. In this map data is displayed of internet users in Europe.

http://jeffhobbs.files.wordpress.com/2008/03/1.gif

Sunday, January 25, 2009

DLG


This map was made using Digital Line Graph (DLG) data. DLGs portray the linear information contained on the USGS topographic maps, such as transportation networks, hydrography, boundaries, elevation contours, and manmade features.

http://ga.water.usgs.gov/olympics/columbus.html

Thursday, January 22, 2009

DEM


This high-resolution digital elevation model, or DEM, for the area around Virginia Beach, Va., designed to improve forecasting for early tsunami warning systems and to help coastal communities prepare for storm-driven flooding. The DEM is constructed from near-shore seafloor depth and land elevation data to create a detailed representation of coastal relief.

http://www.noaanews.noaa.gov/stories2007/s2804.htm

Wednesday, January 21, 2009

Isohyet


Isohyets show average annual rainfall (mm) for stations with more than 20 years of records.

http://www.dpi.nsw.gov.au/agriculture/field/pastures-_and_-rangelands/establishment/clover/part-f---choosing-the-right-sub-clover-v

Tuesday, January 20, 2009

Planimetric Map


A planimetric map is a representation of the horizontal positions of features. It is like an inverse topographic map, which shows the vertical positions. This map of the world 300 million years ago shows the land masses but not the elevation or landscape.

www.geocraft.com/.../Penn_planimetric_map.html

Isobars


The isobars (black lines) on this weather map of Europe and the Mediterranean show the barometric pressure in hectopascals.

http://german.about.com/library/bldwetter_iso01.htm

Isopleths


This is an isopleth map of Hydrogen Ion concentration in the United States in 2003. It shows that there is more Hydrogen Ion concentration in the western part of the United States, and the least amount in the North East.

http://nadp.sws.uiuc.edu/isopleths/maps2003/phfield.gif

Monday, January 19, 2009

Thematic map


Thematic maps display bivariated information such as the soil moisture levels in the United States. Each color represents a different known ‘regime’ and therefore has different characteristics.

soils.usda.gov/use/thematic/moist_regimes.html

Topographic Map


A topographic map shows quantative landscaping information through the use of contour lines. This map is useful because it also shows natural and man made resources such as bodies of water in the surrounding areas or mineral deposits, which is useful for strategical or landscape planning. The different colors and different shades of each color show how deep the water is and how high the mountains are in Albania.

http://maps.grida.no/go/graphic/albania_topographic_map

Sunday, January 18, 2009

cadastral map


A cadastral map shows color-coded boundaries for each district on the map. This type of map is used mostly to determine land or parcel ownership but in this particular instance it is being used for boundaries. The cadastral map shows the lots and their designated numbers in the Alameda Park development.

alamedahistory.org/the-map/

Thursday, January 15, 2009

Cartographic Animation


This is a cartographic animation of Hurricane Katrina approaching Louisiana. This cartographic animation makes it easy to read the hurricane and examine the eye. Because the eye of the hurricane is so important to study, this animation makes determining the severity available to people.

http://www1.ncdc.noaa.gov/pub/data/nexradviewer/katrina/klix-landfall-anim_med.gif

Sunday, January 11, 2009

Continuously variable proportional circle map


A continuously variable proportional circle map is a proportional circle map which utilizes circles to create point data. This relates the scales to the specific data. The circles are in proportion to the variable being measured. In this map, the major industries in each given city is shown using a pie chart.

http://www.lib.utexas.edu/maps/europe/west_germany_ind_1972.jpg

Mental Map


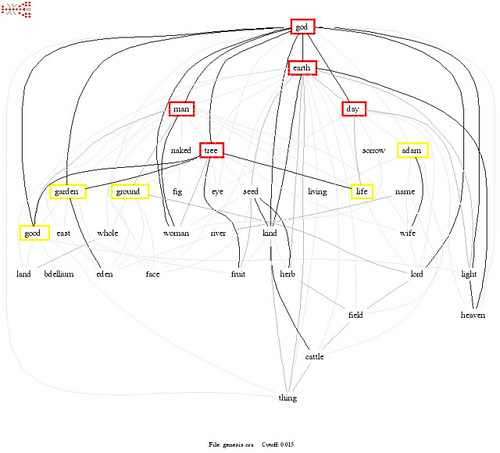
A mental map is a visual display of how that specific person sees the place, object or issue. For each person this map would be totally different and unique because of our different filters an how we interpret our surroundings. This mental map indicates how a person might connect the world around them with a higher being, God.